
- Introduction
The publication of the sixth report by the United Nations International Panel on Climate Changes (IPPC), in August 2021, suggests that the world is likely to reach or exceed 1.5°C, 2° Celsius of global warming in the next decades. There is no way to ignoring this alert that puts in risk the life of all inhabitants of the planet. We must act now, or the impacts of the climate changes will be dramatic.
The world is overcoming the Covid-19 pandemic and there is a consensus that any new world order in the aftermath of the pandemic will include development models aimed at reducing the emission of greenhouse gases. The solutions are well known: the urgency to reduce the use of fossil fuels, to invest in clean energy, to produce clean, to fight deforestation and recover forests.
Brazil and China have strengthened ties in numerous aspects and can benefit from their unmistakable complementarities in the search for more sustainable ways to fight climate change, preserving the growth of their economies, and the well-being of their citizens. They can take advantage of Brazil’s abundance of natural resources, and China’s booming high technology manufacturing sector. For the Brazilian economy, the great challenge is to turn this primary export model into a dynamic factor.
- Trade Flows
Since the last three decades of the last century, and clearly over the first two decades of the 21st century, Brazil’s trade relations with the rest of the world have changed in two directions.
First: as to the origin of its imports and destination of its exports
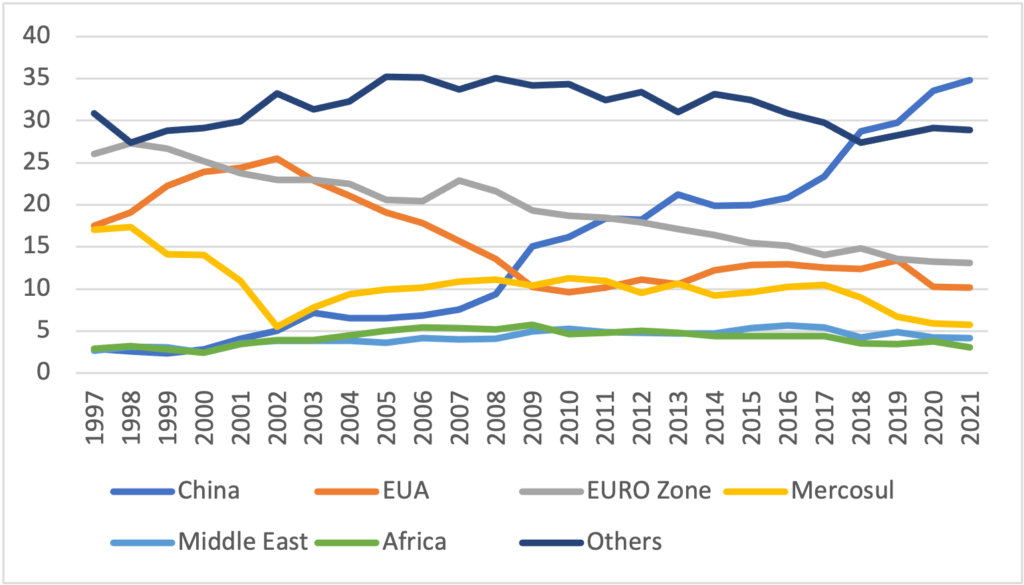
Imports from China, which were in the range of 2.6% in 1997 and 2.8% in 2000, jumped to 21.8% in 2021 as we can see in Graph 1 and Chart 1 a, surpassing the largest partner, which was the United States (US). Note that all major importers, US, and the Eurozone Block, showed a decreasing behavior. The United States went from 22.9%, in the period 1997 to 2000, to 17.6%, in 2021, while the economies of the Euro Zone fell from 25.6%, in the same period, to 19.1%, in 2021.
Graph 1
Evolution of Imports of Brazil by origin of goods and services
In %

Source: Ministry of Economy/Comex Stat – Author’s elaboration.
Graph 2
Trajectory of Exports of Brazil by destination
In %
Source: Ministry of Economy/Comex Stat – Author’s elaboration.
A similar trajectory occurs with exports from Brazil to China and other partners as can be depicted from Graph 2 and Chart 1 b. While exports to China grew from 2.6% on average over the period 1997-2000 to 34.8% in 2021 exports to the US dropped from 20.7% to 10.1% over the same period. Exports to the Eurozone shrank from 26.3% to 13.1%, and to Mercosur dropped from 13.0% to 5.8%. The data also shows that the fall in the period of the health crisis, provoked by Covid-19, does not explain the behavior of the series.
Chart 1 a Chart 1 b
Imports of Brazil from main countries Exports of Brazil to main countries
2020 2020
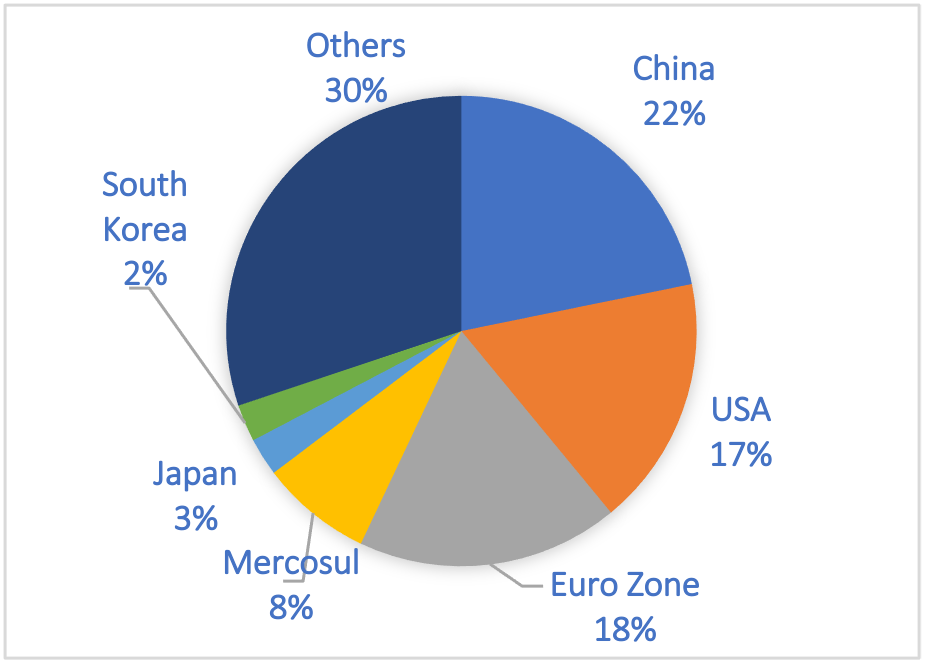
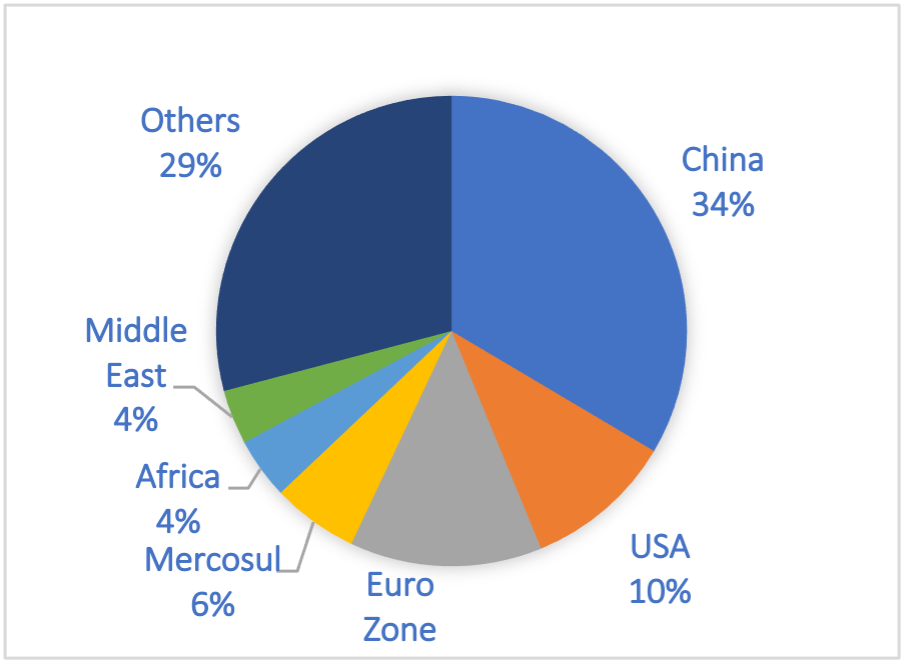 Source: Ministry of Economy/Comex Stat – Author’s elaboration.
Second: Change in Exchange Pattern
It is noteworthy the change in the composition of Brazilian exports along the last two decades. It looks as if the new century would mark a pattern change of exports significantly reducing the exports of manufacturing industry, encompassed by the increasing path of goods based on natural capital, agriculture, and extractive (Graph 3).
Graph 3
Composition of Total Brazilian Exports
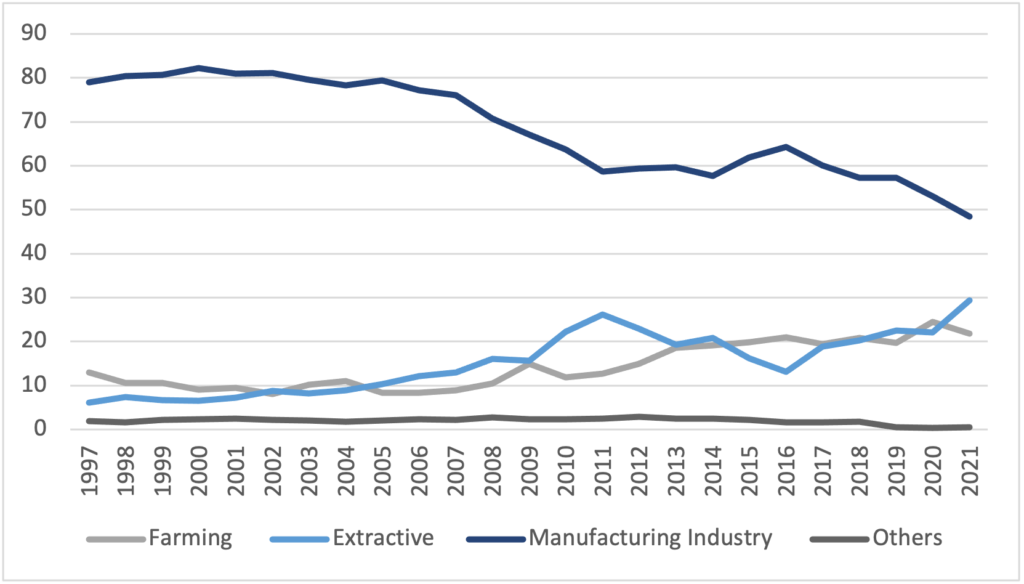
Source: Ministry of Economy/Comex Stat – Author’s elaboration.
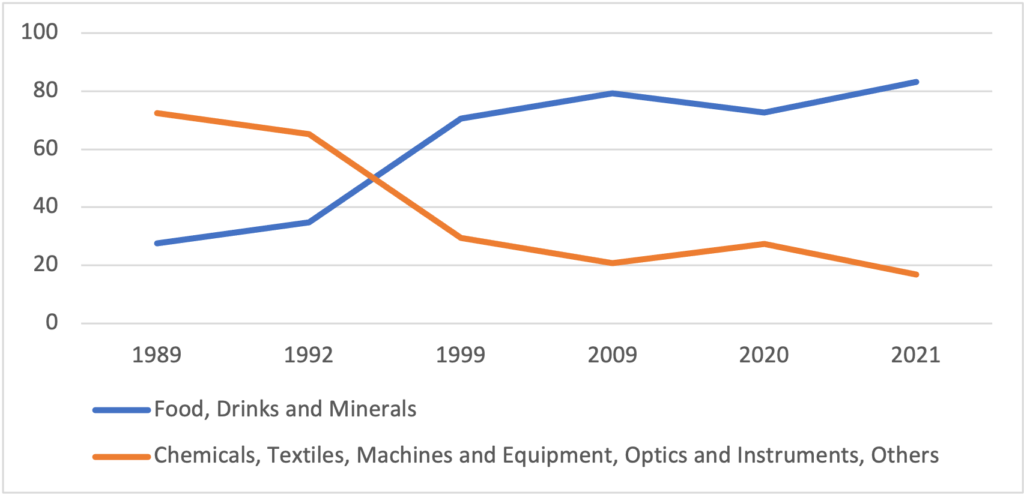
The same, and in a way still more amplified, was the behavior of the composition of the exports to China (Graph 4). In the period after the opening of trade, in the decades that followed 1990, the two groups of primary products, food and beverages and minerals, showed high growth rates in exports. These two groups of primary products increased from a 27.6% share of exports to China in 1989 to almost 83% in 2021. Exports of manufactured goods to China behaved in the opposite direction, representing 72,4 % of the total in 1989, dropped to 20,7% in 2009, and reached 16,9% in 2021)
Graph 4
Composition of Brazilian Exports to China
The composition of China’s exports to Brazil looks like a mirror image of Brazil’s exports to China as we can depict from Graph 5. China’s exports of basics goods (food, drinks, and minerals) to Brazil went from 70% in 1989, to practically zero in 2021. On the other hand, Brazil’s imports of manufactured goods (chemicals, textiles, machines and equipment, optics and instruments, and others) from China, that represented around 30% in 1989, reached almost 100% in 2012.
Graph 5
Composition of China’s Exports to Brazil
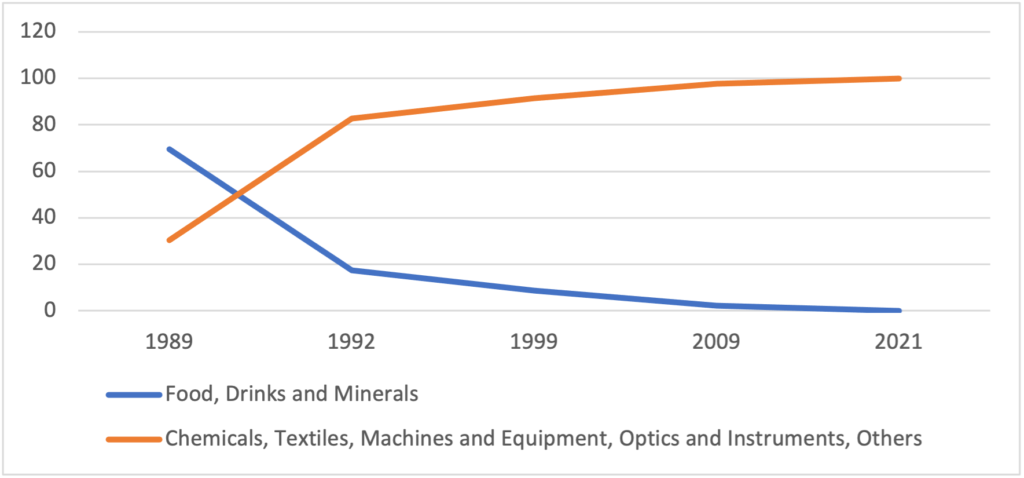
Source: Ministry of Economy/Comex Stat – Author’s elaboration.
In addition to an unprecedented rise in trade with China, there is also a shift in the export and import agenda.
The conclusion is that China is nowadays our biggest trading partner, and the agenda is mainly composed of Brazil’s commodity exports and imports of medium and high technology manufactured goods. In other words, Brazil exports primary goods based on natural capital while imports goods coming from the manufacturing industry, intensive in capital and technology.
- Examining recent trade performance between Brazil and China
In 2020, China became Brazil’s first trade partner to surpass the historic mark of a trade flow (exports + imports) more than US$ 100 billion. There were US$ 101.7 billion traded by the two countries. Brazilian exports reached a record figure of US$ 67.7 billion, and imports totaled US$ 34.0 billion. Last year, trade exchange with China provided Brazil with a surplus of US$ 33.7 billion, corresponding to approximately 65% of the total balance accumulated by Brazil with all countries in the period, according to the Foreign Trade Secretariat of the Ministry of Economy (SECEX).
There was also a significant increase in Chinese participation as the largest importer of Brazilian products and the main Brazilian supplier worldwide. With exports registering an increase of 6.8%, China had a 32.3% share of all the volume exported by Brazil, while regarding Brazilian imports, China had a share of 21.4%.
The Sino-Brazilian foreign trade numbers are truly impressive, and it is worth noting the fact that China was the main destination for at least four of the main products exported by Brazil in 2020. In the case of soybeans, for example, exports totaled US$ 20.9 billion (31% of the total volume shipped to China), while iron ore sales, the second most important item in the Brazilian export basket, were exported US$18.5 billion (27% share of total sales to the Chinese) and oil sales totaled US$ 11.3 billion, equivalent to 17% of shipments to the Asian giant.
What has been observed, in the recent period, is that Brazil lost its ability to export manufactured goods to the rest of the world, and to China, and started to export commodities. In other words, there is a shift towards a model that presents characteristics of a primary-exporting economy, with its biggest trade partner being China.
- How to escape the primary-export characteristic of the Brazil-China relationship?
The question that arises is:` What made Brazil lose its ability to export manufactured products to the rest of the world, and to China, and what led us to export commodities?
Bacha and Fishlow (2011) analyze this question suggesting that trade with China could represent a return to the past when Brazil had not yet gone through the process of import substitution. What happened after all that led to a change in Brazil’s exchange pattern? Would it mean the failure of a whole long process of import substitution? What are bygones are bygones. It is interesting to appreciate the clear disadvantage that Brazil is having in relation to high technology products. We have, as we always had, advantages in goods and services that are intensive in natural capital. These advantages are very clear in the return to the primary-export pattern we experienced before. There is a difference, however, in the production process. Although it does not add significant value added from labor, it (continues to) increases productivity through intensive use of modern planting and harvesting machines reducing cost and making the product even more competitive.
An interesting analysis comes out from the measure of the technological intensity of the products marketed after the commercial opening at the end of the last century. ECLAC (CEPAL) studies on Brazil-China trade present results (Table 1) that elucidate these points. Brazil’s exports of high and middle-tech products represented 10.2% while China’s exports of products of this nature reached 67% in 2009. On the other hand Brazil’s exports of primary products, (76.78% ), plus manufactures based on natural resources, (11.26%) and manufactures of low technology,(1.71%) represented almost 90%.
Table 1: Technological Intensity of trade between Brazil and China (2009)
| Primary | Natural Res. | Low Tech | Mid Tech | High Tech | |
| Products | Based | ||||
| Imports | 1,16 | 11,12 | 20,8 | 25,25 | 41,67 |
| Exports | 76,78 | 11,26 | 1,71 | 7,88 | 2,37 |
Studies by Feistel and Hidalgo (2012) implemented factor intensity tests using Brazilian input-output matrix and clearly showed that the factors of production that dominate the Brazil’s exports are natural resources and labor (Graph 6). While Chinese products are intensive in capital (Graphs 6 and 7).
Graph 6 – Factor Intensities of Brazil’s Exports to China – 1989 -2009
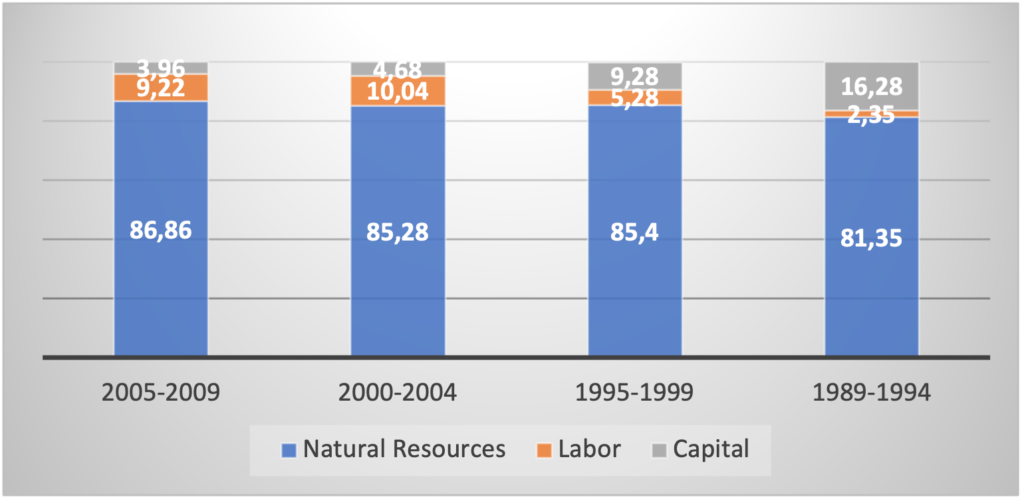
Source: Feistel and Hidalgo (2012)
Graph 7 – Factor Intensities of Brazil’s Imports from China – 1989 -2009
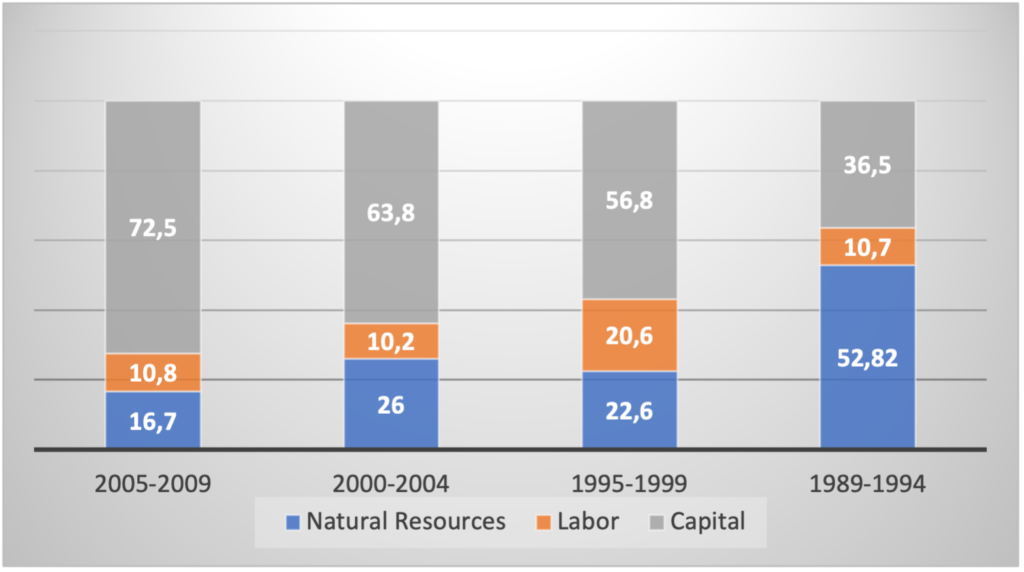
Source: Feistel and Hidalgo (2012)
4.1 Added Value
The Cold War that is reborn between the United States and the Eurozone in relation to China, in terms of technological supremacy, opens the way for the expansion of trade negotiations between Brazil and China. In this vein, it is necessary for Brazil to condition its exports to the addition of value since they are mostly constituted of in natura primary products. For exports to have a greater effect on GDP and the growth of the Brazilian economy, it is essential that exports undergo some type of transformation and become semi-manufactured. There are two impacts of this policy: i) increased forward effects, adding value; ii) significant gains from economies of scale, participating in Chinese markets. We can say that part of the success of Chinese growth is linked to the size of its market. The second impact would allow Brazil to share the export model with the Chinese expansion, with a growing increase in productivity – coming in part from the countryside, the value added through technical processes, could benefit from the size of the Chinese market.
- How to move towards a sustainable complementarity relationship
Where does the issue of sustainability arise? Ensure that trade encourages products that emit less CO2.
In the case of developing economies, and in particular Brazil, exportable products emit less CO2 in their production. This has to do with the energy matrix that is much more renewable than that of the world. While in 2019 the world matrix was only 14% made up of renewable energy, Brazil’s was at 45%, with sugar cane derivatives, 18%; hydraulic energy, 12,4, and natural gas 12,2 among others.
In the electric energy matrix, the difference between Brazil and the world is even greater: world only had 25% of renewable electric energy in 2019 while Brazil had 83%. The Brazilian electric matrix is composed of hydraulic energy, 64.9%; biomass, 8.4%; wind energy, 8.6%; solar energy, 1%; natural gas, 9.3%; oil products, 2%; nuclear, 2.5%; coal and derivatives, 3.3% (see Wikipedia). This certainly represents an incredible asset in the search for a more sustainable world.
Nevertheless, some cases should be highlighted. Soy production is a good example. The deforestation that accompanies the expansion of soy through the Amazon releases CO2 that was being stored by the forest. Soy, meat, and iron ore are the most important products that Brazil exports to China, but they are also the main vectors for the expansion of the agro-mineral frontier, deforestation, land conflicts and violence in the rural areas.
With the domestic cost of soy production very high, China produces only 15 million tons a year what is a lot but not sufficient for China’s need. China wisely bans the use of genetically modified soy in everyday foods. But the restriction does not apply to soybeans used for animal feed and to produce cooking oil, therefore, the inputs used in these activities today come mainly from foreign crops with altered traits by bioengineering – from which Brazil is the main supplier. In Brazil, transgenic soy already occupies almost all areas destined for the cultivation of this oilseed.
On the other hand, most of the high-tech Chinese products that we import also affect CO2 emissions in greater volume through the intensive use of energy based in coal-fired thermoelectric power plants. This has been an issue on China’s sustainability and for that there is a commitment that the peak of CO2 emission due to thermoelectric power will be 2030.
This suggests that a policy of sustainability in trade between Brazil and China is needed. The topic ‘green recovery’ has been guiding trade discussions between developing and developed countries. Krugman (The New York Times, July 16, 2021) addresses the proposal of the American Democratic Party, that proposes that tariffs should be created on imports from countries that do not use actions to limit GHG emissions. A similar proposal was made by the European Union.
Trade negotiations between Brazil and China should primarily focus on adding value to exported primary products and benefiting from the economies of scale in the Chinese market. And secondly, by establishing negotiations that make these exchanges positive for the reduction of CO2 emissions, allowing Brazil to benefit even more from the comparative advantages in carbon trading. In exchange, China, in addition to having to redeem carbon credits, would be encouraged to promote joint projects with Brazil aimed at increasing the sustainability of the exchanges.
- Concluding remarks
From what was exposed it is possible to suggest that we are back to the model of specializing in primary goods. After a century of import substitution implementation, is the Brazilian economy going back to the primary export goods model, accepting the old comparative advantage theory? Has the China’s hunger for commodities led the change in the pattern of the Brazilian development? Is it possible to assume that we have been contaminated by the Dutch disease? What can be done to reverse or reduce the costs of primarization of our development model?
References:
Bacha, E and Albert Fishlow. The Recent Commodity Price Boom and Latin American Growth: More than New Bottles for an Old Wine? The Oxford Handbook of Latin American Economics edited by J.A. Ocampo and Jaime Ros. July: 2011.
Bacha, E. e de Bolle M.R. O futuro da indústria no Brasil: desindustrialização em debate. São Paulo: EDUSP 2014.
CEPAL, División de Comercio Internacional e Integración (2010).
Feistel. P.R; Hidalgo, A.B. O intercâmbio comercial Brasil China A questão das Vantagens Comparativas, Análise Econômica, Porto Alegre, ano 30, n.57, p.175-203. (2012)